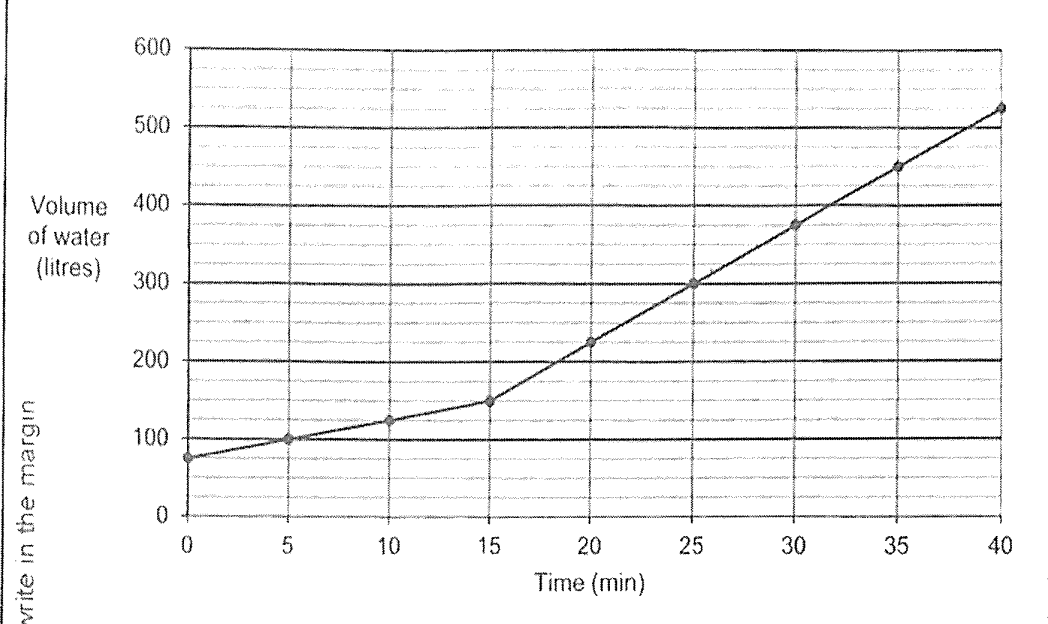
4 gaps → 100 ℓ; 1 gap → 25 ℓ; 3 gaps → 75 ℓ. At 0 min: 75 ℓ. At 10 min: 125 ℓ. Increase = 125 − 75 = 50 ℓ.
Question 26a
Video explanation ↓The line graph shows the volume of water in a tank over 40 min. Tap A was turned on for 40 min for water to flow into the tank. 15 min after Tap A was turned on, Tap B was also turned on. (a) What is the increase in volume of water over the first 10 minutes?