More than 1 device % = Group C + Group D = 10 + 5 = 15%
80 (40%) students do not have digital device. 40% → 80 1% → 80 ÷ 40 = 2 15% → 15 × 2 = 30
The table below shows a group of students and the number of digital devices they owned in a survey conducted. The pie chart shows the percentage of students in each group. Study the table and pie chart carefully. How many students had more than 1 devices? (2 marks)
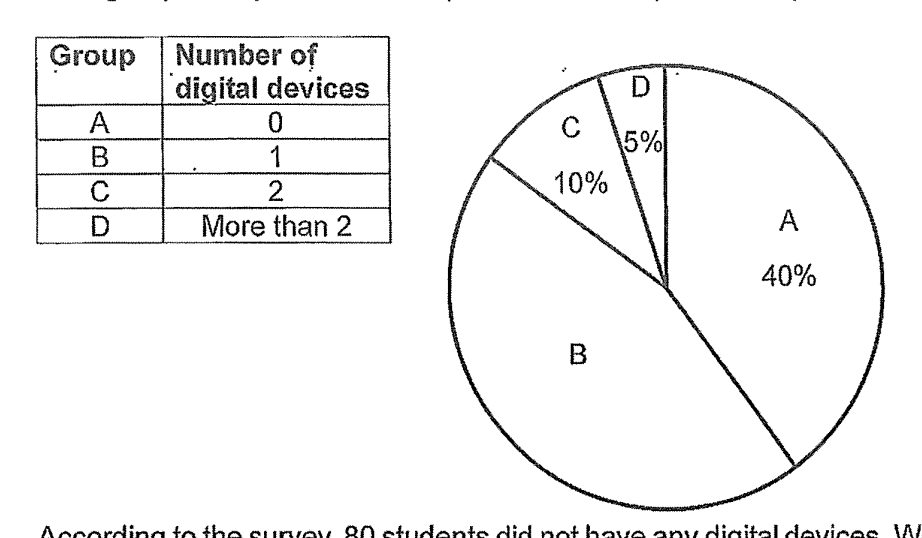
More than 1 device % = Group C + Group D = 10 + 5 = 15%
80 (40%) students do not have digital device. 40% → 80 1% → 80 ÷ 40 = 2 15% → 15 × 2 = 30