Independent verification and solution:
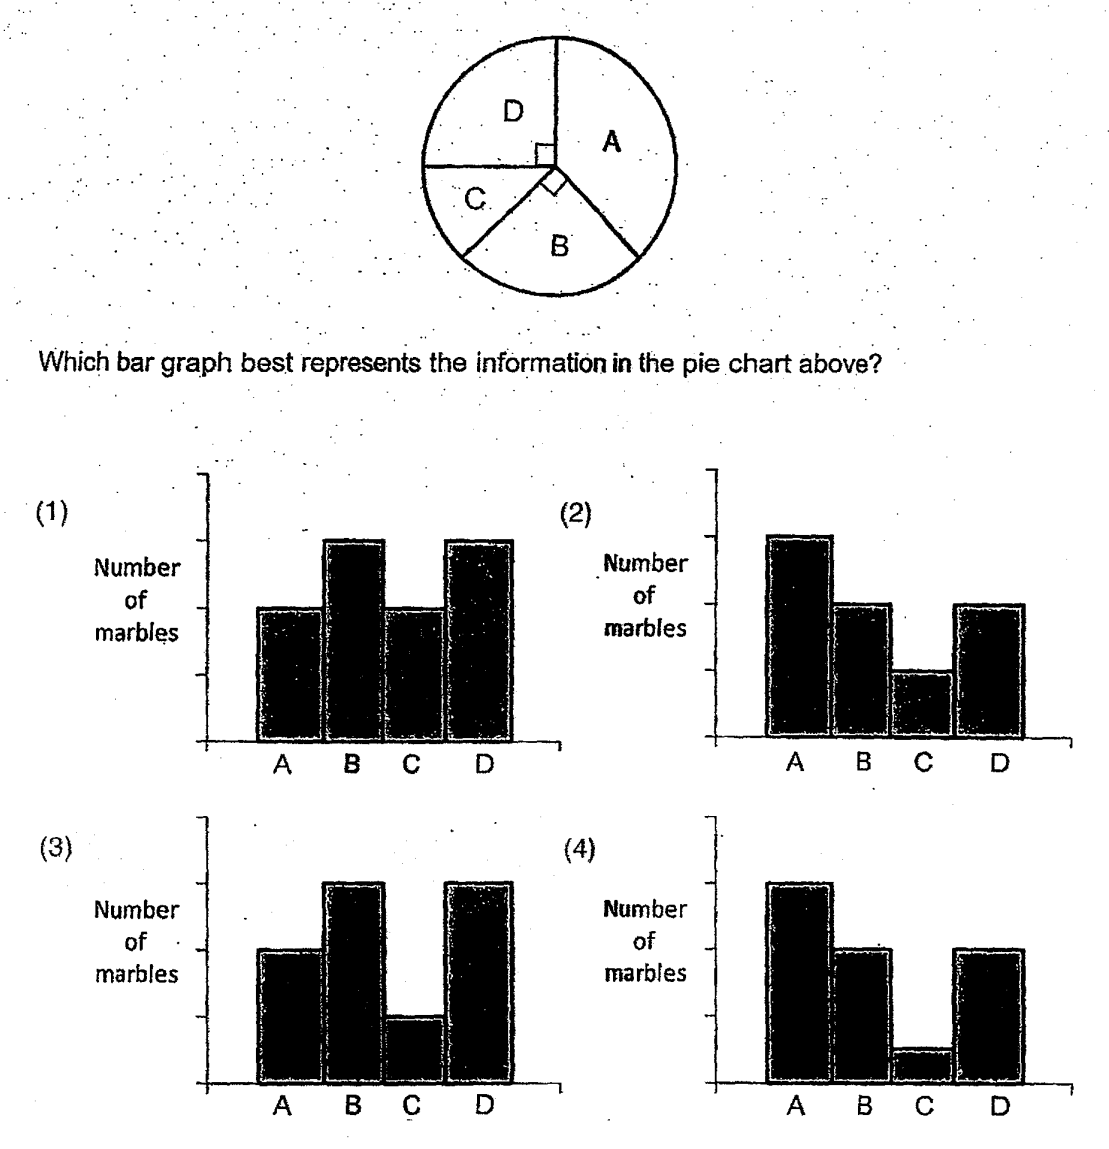
The right-angle marks show that B and D each occupy one quarter of the pie, so their bar heights must be equal and together represent half of all marbles. A is larger than B and D, while C is smaller.
Graph (2) has bar heights in the ratio A : B : C : D = 3 : 2 : 1 : 2. B and D each represent 2/8 = 1/4 of the total, A is the largest, and C is the smallest. Graph (4), although it has the same ordering, does not make B and D together half the total. Only graph (2) matches all the information.