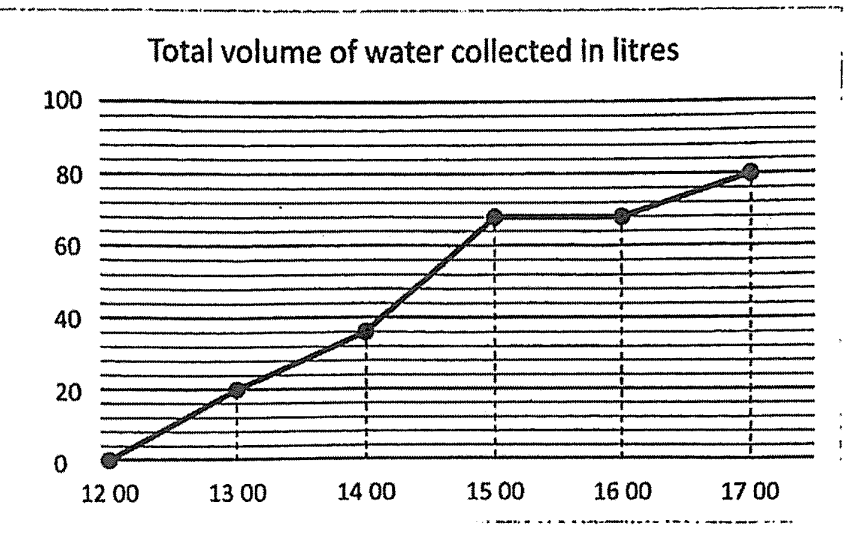
The source marks the horizontal graph segment from 15 00 to 16 00: no water flowed into the tank during this interval.
Question 10a
Video explanation ↓The line graph shows the total volume of water collected in a tank from 12 00 to 17 00. (a) During which one-hour interval was there no water flowing into the tank? (1 mark)