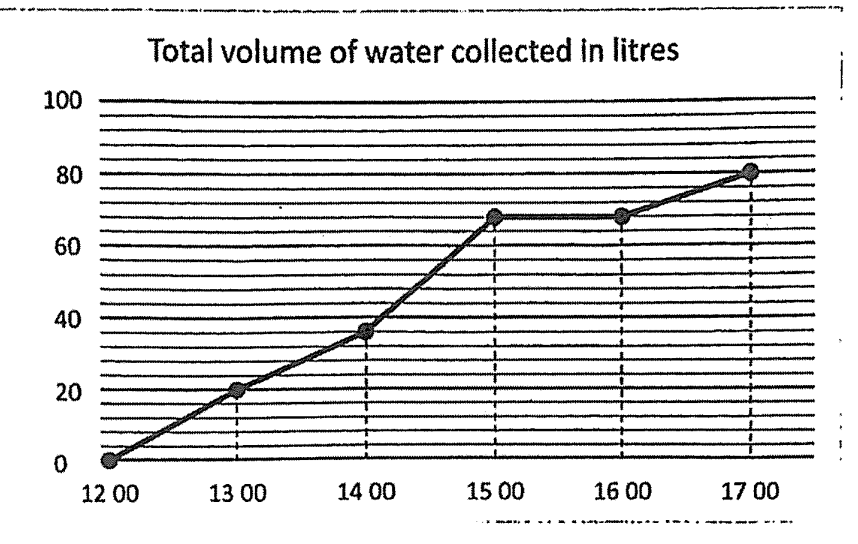
At 17 00 the total was 80 ℓ. The interval from 12 00 to 17 00 is 5 hours.
Average collection per hour = 80 ÷ 5 = 16 ℓ per hour.
The line graph shows the total volume of water collected in a tank from 12 00 to 17 00. (c) What was the average volume of water collected per hour? (2 marks)
At 17 00 the total was 80 ℓ. The interval from 12 00 to 17 00 is 5 hours.
Average collection per hour = 80 ÷ 5 = 16 ℓ per hour.