Independently derived solution.
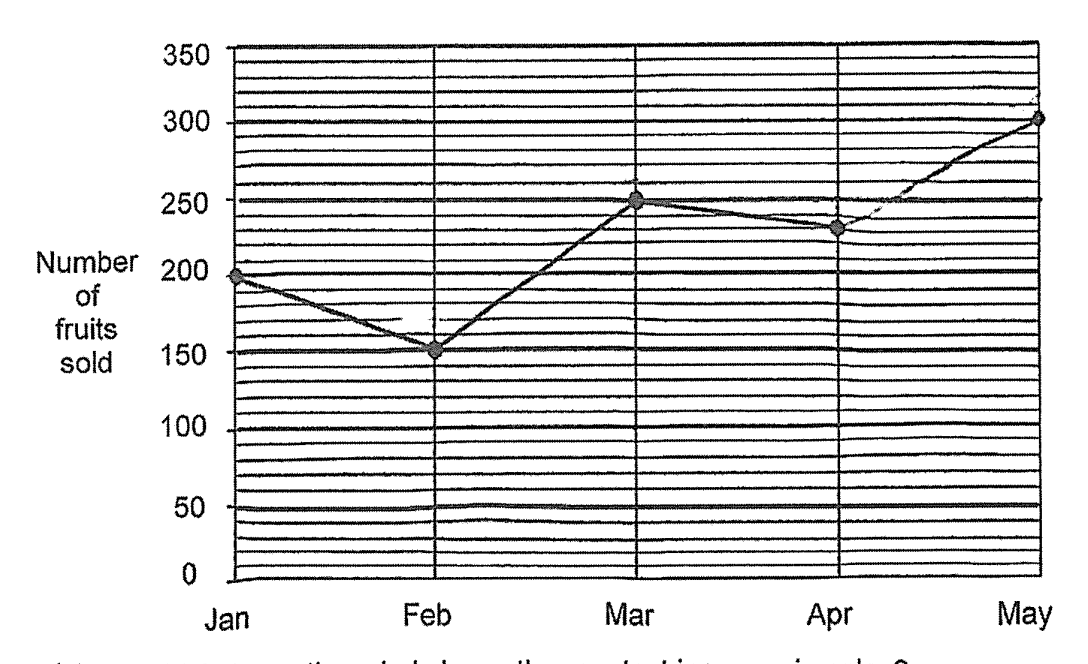
Read the monthly sales as January 200, February 150, March 250, April 230 and May 300 fruits.
The consecutive changes are 150 − 200 = −50, 250 − 150 = 100, 230 − 250 = −20 and 300 − 230 = 70 fruits. The largest increase is 100 fruits, from February to March. The handwritten source comparison 300 − 230 = 230 is incorrect; the correct increase from April to May is 70.