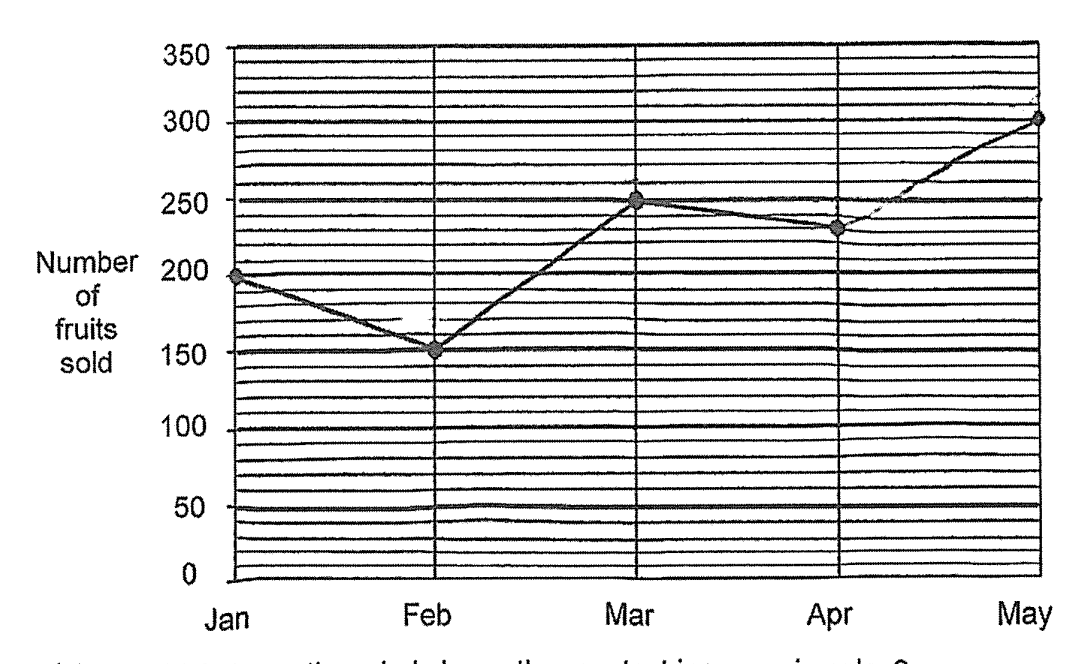
Jan → 200 Feb → 150 Decrease = 200 − 150 = 50 % decrease = 50/200 × 100 = 25%
Question 14b
Video explanation ↓The line graph shows the monthly sales of fruits from January to May. What was the percentage decrease in the number of fruits sold from January to February? (1 mark)