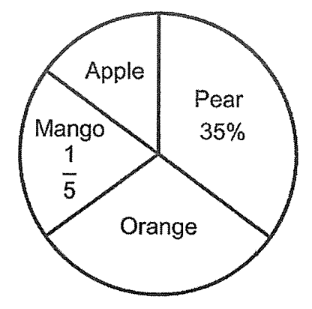
A group of students were asked to choose their favourite fruit in a survey conducted. The result was represented in the pie chart. Half of the number of students chose mango or orange as their favourite fruit. True, false or not possible to tell: More students were surveyed and all of them chose mango as their favourite fruit. The percentage of students who chose apple as their favourite fruit remained the same.
Answer: False
Workings
Loading drawing…
Loading drawing…
For example, let's take total student as 100 students
mango (%) → 20%
mango (students) → 20% x 100 = 20
apple (%) → 15%
apple (students) → 15% x 100 = 15
" More students were surveyed and all of them chose mango as their favourite fruit."
Let's say more students are 20
total student → 100 + 20 = 120
new apple % → 15/120 x 100 = 12.5%
apple at first (%) → 15%
That means % of student who chose apple did not remain the same
Video explanations
1 video