Loading drawing…
Loading drawing…
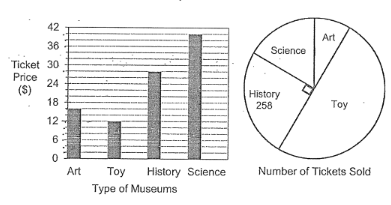
3 gaps → $6 1 gap → 6 ÷ 3 = $2
ticket price art → $16 toy → $12 history → $28 science → $40
The Toy Museum sold half of the total number of tickets sold on Sunday.
toy → 1/2
from pie chart history → 1/4
science + art = total - toy - history = 1 - 1/2 - 1/4 = 1/4
science + art = history science + art = 258
The number of tickets sold by the Science Museum was twice the number of tickets sold by the Art Museum.
science → 2u art → 1u science + art → 2 + 1 = 3u science + art = 258
number of tickets 3u (history) → 258 1u (art) → 258 ÷ 3 = 86 2u (science) → 86 x 2 = 172 6u (toy) → 86 x 6 = 516
amount of tickets sold art → 86 x 16 = $1376 toy → 516 x 12 = $6192 history → 258 x 28 = $7224 science → 172 x 40 = $6880
Answer: History with $7224