Loading drawing…
Loading drawing…
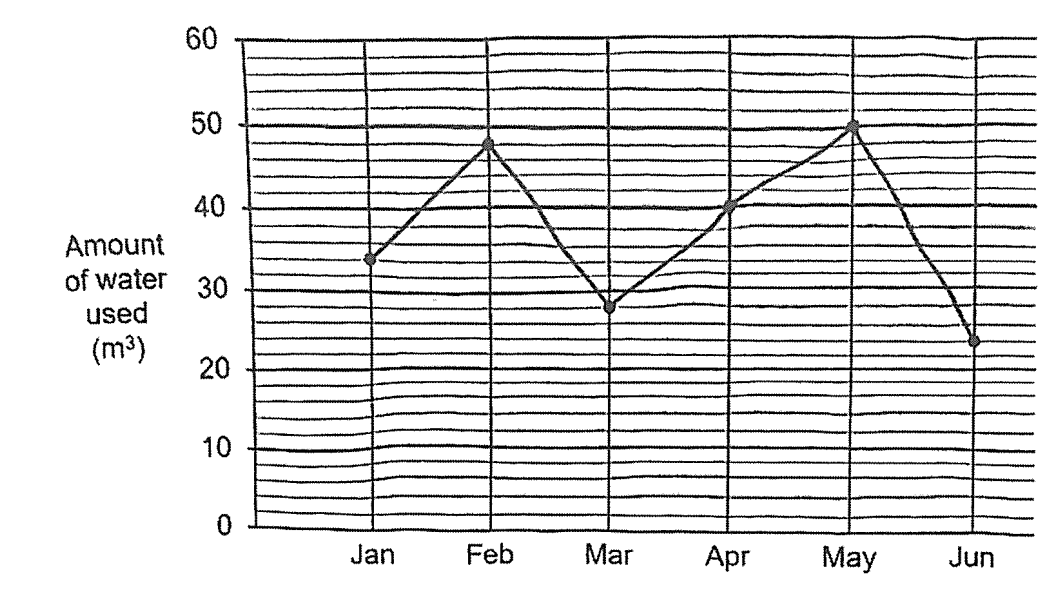
5 gaps → 10 1 gap → 10 ÷ 5 = 2
April → 40 May → 50
difference → 50 - 40 = 10
percentage increase → difference ÷ april x 100% = 10 ÷ 40 x 100% = 25%
The line graph shows the volume of water the Tan family used from January to June. What was the percentage increase in the water used from April to May? (1 mark)
Answer: 25 %
Loading drawing…
Loading drawing…
5 gaps → 10 1 gap → 10 ÷ 5 = 2
April → 40 May → 50
difference → 50 - 40 = 10
percentage increase → difference ÷ april x 100% = 10 ÷ 40 x 100% = 25%