Loading drawing…
Loading drawing…
5 gaps → 10 1 gap → 10 ÷ 5 = 2
1200 → 50 1300 → 44 1400 → 32 1500 → 10
1200 to 1300 → 50 - 44 = 6 1300 to 1400 → 44 - 32 = 8 1400 to 1500 → 32 - 10 = 22
A tank was filled with 50 l of water at 12 00. Water flowed out of the tank from 12 00 to 16 00. The line graph shows the amount of water in the tank from 12 00 to 16 00. During which one-hour period was the decrease in the volume of water the greatest? (1 mark)
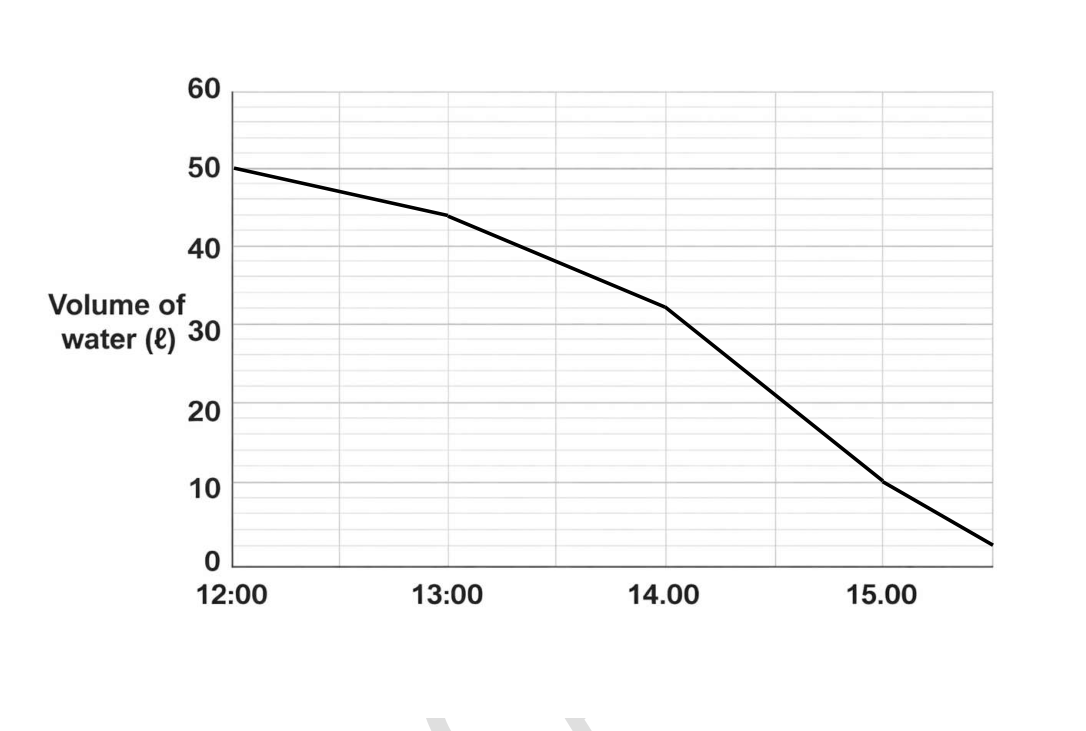
Answer: Between 14 00 and 15 00
Loading drawing…
Loading drawing…
5 gaps → 10 1 gap → 10 ÷ 5 = 2
1200 → 50 1300 → 44 1400 → 32 1500 → 10
1200 to 1300 → 50 - 44 = 6 1300 to 1400 → 44 - 32 = 8 1400 to 1500 → 32 - 10 = 22