At the end of Day 6, 40 ovens were unsold, so 150 − 40 = 110 ovens had been sold.
The number sold in 7 days was 7 × 20 = 140. Therefore 140 − 110 = 30 ovens were sold on Day 7.
A departmental store had 150 ovens for sale during a 7-day period. The line graph shows the number of ovens left unsold at the end of each day. The number of ovens left unsold at the end of Day 7 was not shown. (a) The average number of ovens sold over the 7-day period was 20. How many ovens were sold on Day 7? (2 marks)
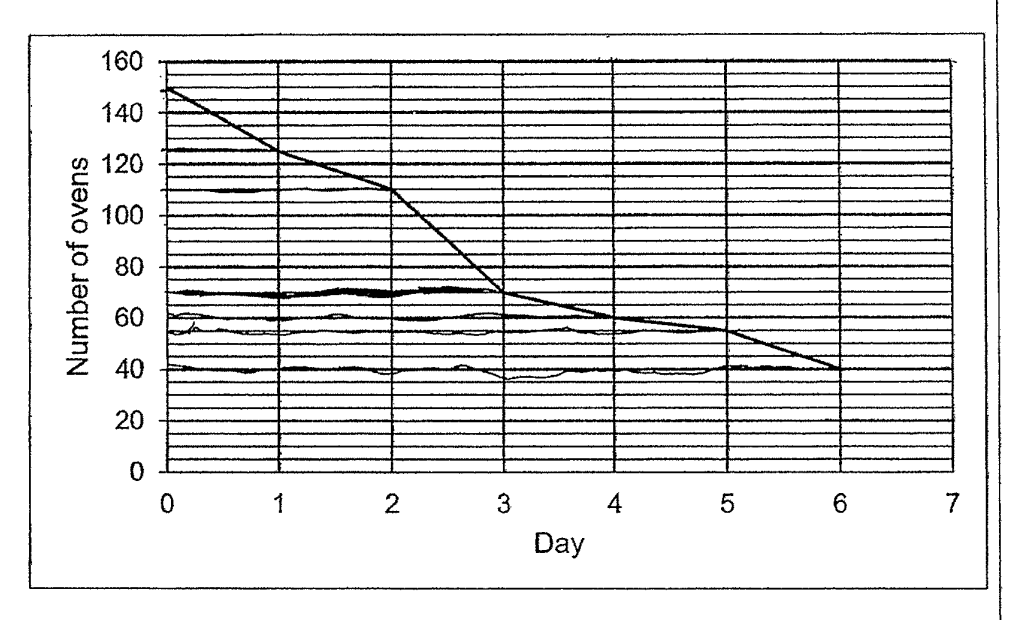
At the end of Day 6, 40 ovens were unsold, so 150 − 40 = 110 ovens had been sold.
The number sold in 7 days was 7 × 20 = 140. Therefore 140 − 110 = 30 ovens were sold on Day 7.