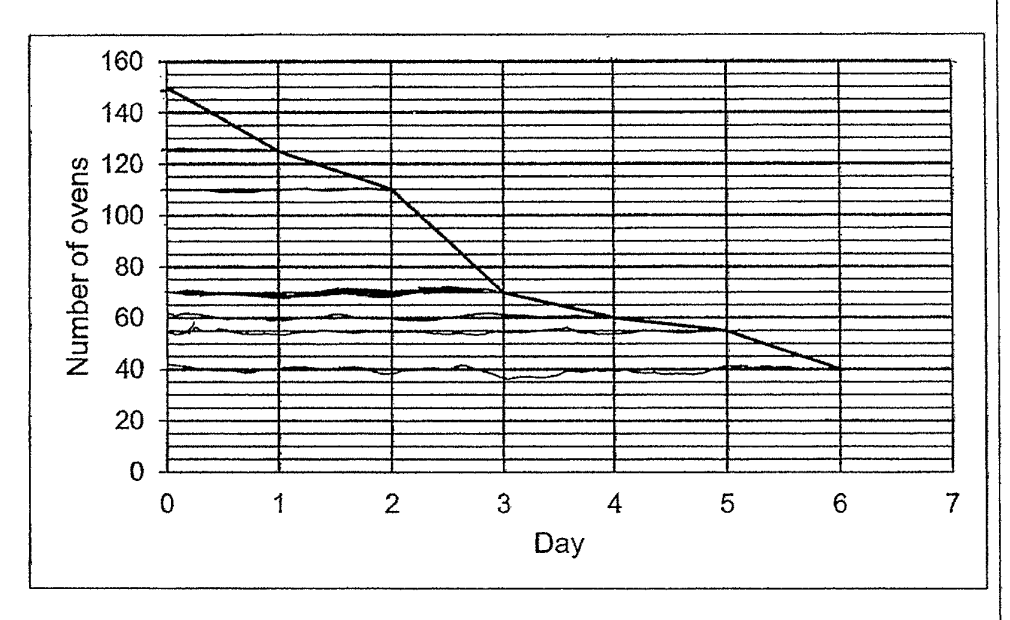
The source graph annotations show daily sales of 25, 15, 40, 10, 5, 15 and 30 ovens. The greatest number was sold on Day 3.
Question 13b
Video explanation ↓A departmental store had 150 ovens for sale during a 7-day period. The line graph shows the number of ovens left unsold at the end of each day. The number of ovens left unsold at the end of Day 7 was not shown. (b) On which day was the greatest number of ovens sold? (1 mark)