Starts at 20 20; ends at 21 00. 20 20 to 21 00 = 40 min.
Question 30
Video explanation ↓The line graph shows the temperature of water in a tank from 20 00 to 21 00. For how many minutes was the temperature of the water 40°C and above? (2 marks)
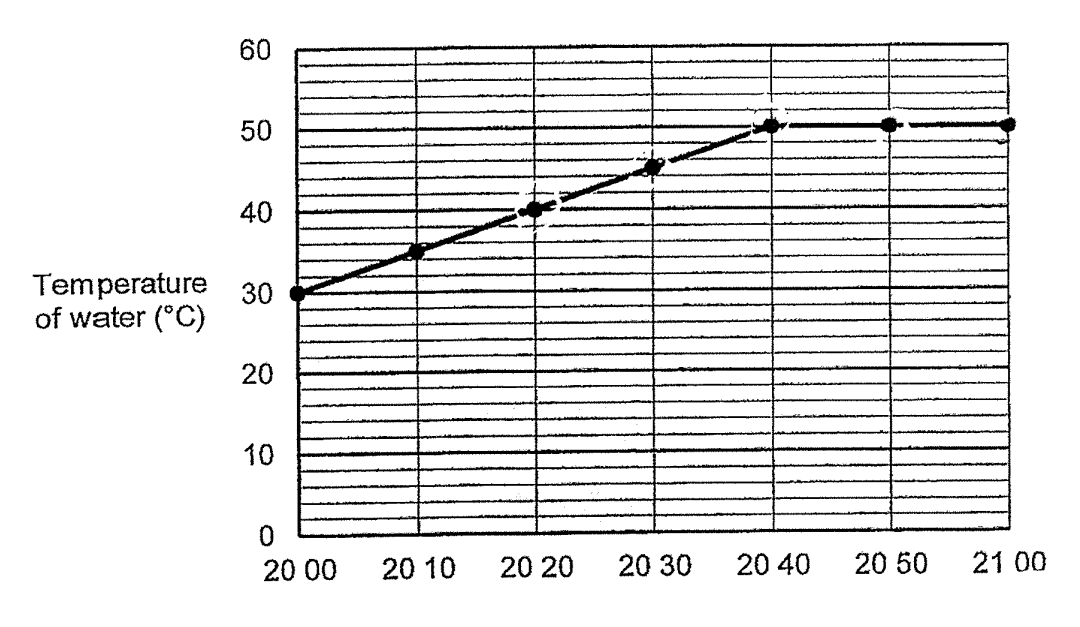
The line graph shows the temperature of water in a tank from 20 00 to 21 00. For how many minutes was the temperature of the water 40°C and above? (2 marks)
Starts at 20 20; ends at 21 00. 20 20 to 21 00 = 40 min.