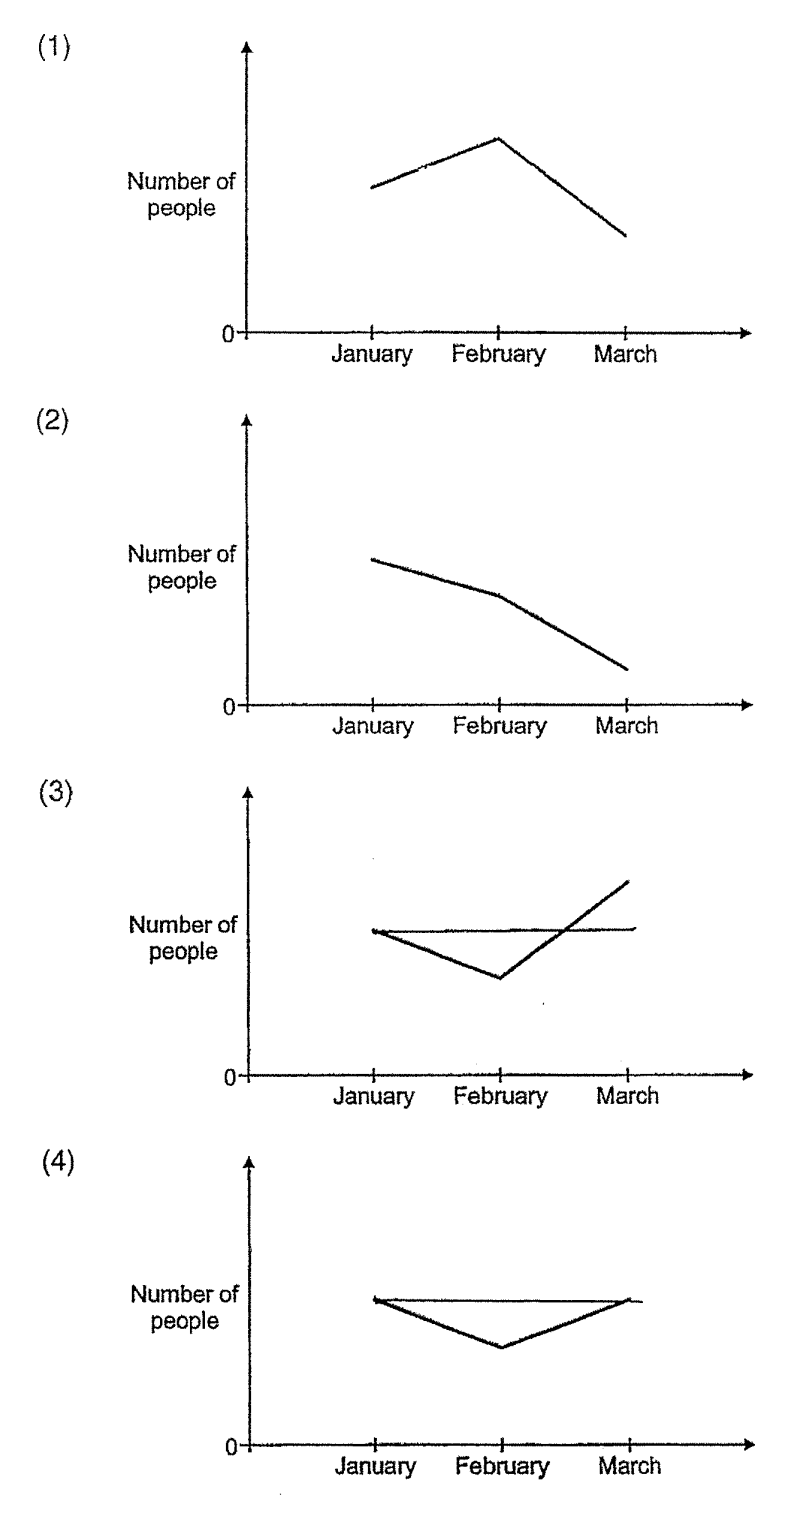
January to February: −30. February to March: +60. March should be higher than January.
Question 9
Video explanation ↓The number of people visiting the funfair decreased by 30 from January to February and increased by 60 from February to March. Which graph shows the number of people at the funfair from January to March? (1 mark)