← Henry Park Primary School · Paper 22025 / Henry Park Primary School · Paper 2 / Question 7a

Question 7a

Video explanation ↓

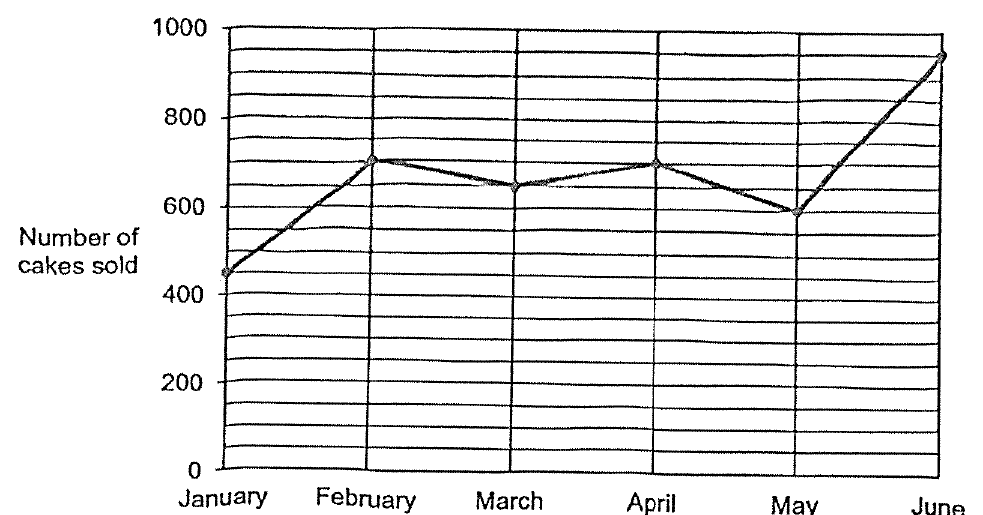
The line graph shows the number of cakes sold each month from January to June. The number of cakes sold in 6 months from July to December is not shown. During which one-month interval was the increase in the number of cakes sold the greatest? (1 mark)

Question 7a diagram

Answer: May to June

Workings

Loading drawing…

"During which one-month interval was the increase in the number of cakes sold the greatest?"

easiest way to answer greatest increase is to count number of gaps between 2 months

and only go for lines that goes up

jan to feb → 5 gaps increase

mar to april → 1 gap increase

may to june → 7 gap increase

Video explanations

1 video