Loading drawing…
Loading drawing…
4 gaps → 200 1 gap → 200 ÷ 4 = 50
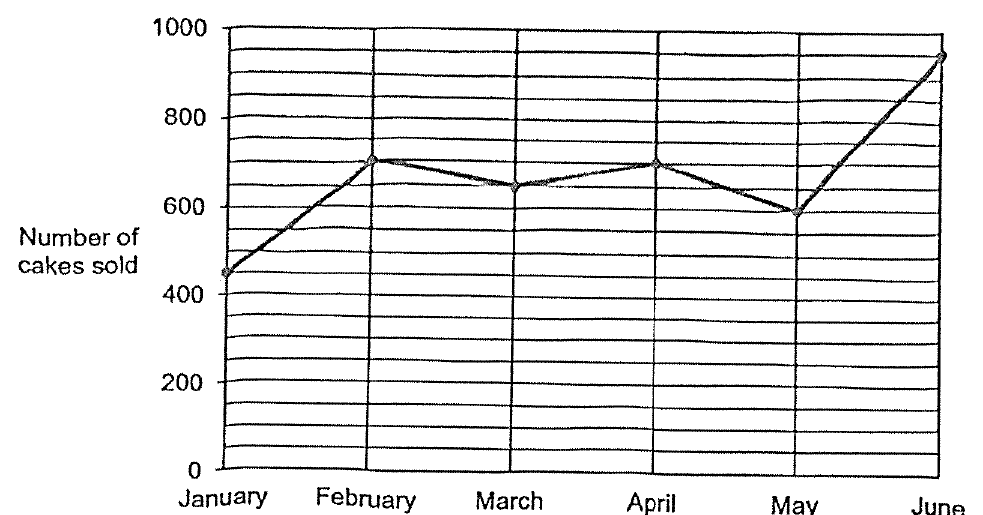
January → 450 February → 700 March → 650 April → 700 May → 600 June → 950
total → 450 + 700 + 650 + 700 + 600 + 950 = 4050
The line graph shows the number of cakes sold each month from January to June. The number of cakes sold in 6 months from July to December is not shown. How many cakes were sold for the first half of the year from January to June? (1 mark)
Answer: 4050 cakes
Loading drawing…
Loading drawing…
4 gaps → 200 1 gap → 200 ÷ 4 = 50
January → 450 February → 700 March → 650 April → 700 May → 600 June → 950
total → 450 + 700 + 650 + 700 + 600 + 950 = 4050